Note that the
exact name given to relationships (or entities for that matter) is immaterial
--
you may use any descriptive name. Also, depending on the name given to the relationship, the link between
related entities
can
be read in
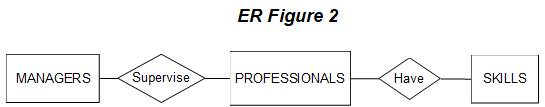
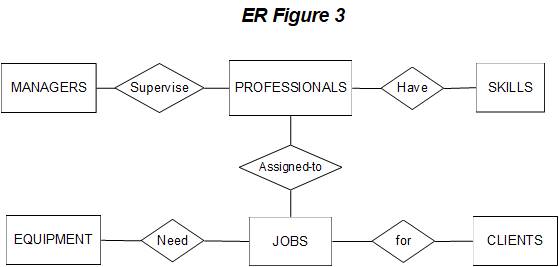
either direction. In the figure
above, since the
name of the relationship between PROFESSIONALS and
SKILLS is "Have," the appropriate way to read the relationship is "professionals have skills" (rather than
"skills have professionals"!). To read the relationship
beginning from the SKILLS
entity, the relationship would have to be worded something like "possessed by" (skills are possessed by professionals).
Upon further analysis
of
the business processes,
the
analyst determines the following:
(1)
jobs are performed for clients, (2) professionals are assigned
to jobs, and
(3) jobs need equipment. The above ER diagram can be further
modified to show jobs, clients, and
equipment. With these
additions, you can see
that the ER model shown below depicts many aspects
of the operations of a CPA firm.
Extended Entity-Relationship (EER) model
The
ER model presented above has been the
subject of a number of
enhancements and
extensions. As you can see
above, the basic ER model shows
only entities and the
relationships between entities. It does not
show the type of relationship in terms of the cardinality of each relationship.
You might recall our discussion of
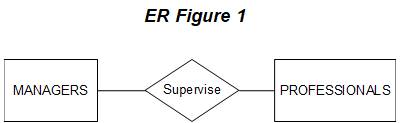
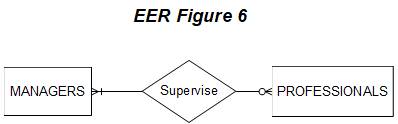
relationship cardinality in Chapter 6 where we discussed how relationships could be either 1:1, 1:M, or M:M. So the basic
ER model in Figure 1
showing that managers supervise professionals
does not show whether a
manager supervises one or many professionals, and whether a
professional is supervised by only one or more than one manager.
The basic
ER model
also does
not indicate whether relationships
are mandatory or optional (referred
to as the optionality of relationships). Returning to the manager--
professionals diagram in Figure 1, it does not show whether
a manager must
be supervising professionals, or
whether a professional
must
be supervised by managers. Finally,
the basic ER model does not show the attributes of each entity
and relationship and in particular the primary key of
each entity and relationship (if applicable). Extended entity-relationship (EER) models show all of the above characteristics (cardinality, optionality, and attributes).
We will now
discuss how cardinality, optionality, and attributes of entities and relationships
are depicted in an EER diagram. Consider
the relationship between MANAGERS and
PROFESSIONALS shown in Figure 1.
If a manager supervises exactly
one professional, and each
professional is supervised by exactly
one manager, then
the ER diagram shown in Figure 1 is
accurate with respect
to the cardinality of the
relationship between
managers and professionals.
However, let us assume that a manager can supervise many professionals
(clearly a more realistic
assumption). However, each professional is supervised by only one manager.
That is, the relationship between MANAGERS and
PROFESSIONALS is 1:M. The EER
would now appear
as follows.
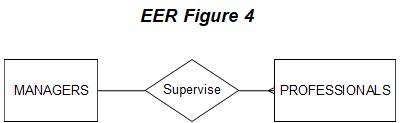
Note the
"crow's foot" at the connection to the PROFESSIONALS entity. The purpose
of the "crow's foot" is
to show that many professionals are supervised by a manager.
The relationship between managers and professionals can be read both
ways: ONE manager
supervises MANY professionals or MANY professionals are supervised by ONE manager.
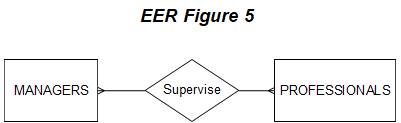
Let us now modify the
above diagram to show that
it
is possible for a professionals
to
be supervised by more than one manager (e.g., a professional may have a different
manager on different jobs that s/he may be working
on). The relationship between
MANAGERS and PROFESSIONALS is thus many-to-many (M:M). As you might
suspect, another crow's foot is shown,
this time on the MANAGERS entity, as shown
below.
Now let
us consider how the optionality of relationships is
depicted in EER. An entity's
participation in a relationship
can either be mandatory or optional.
In the above managers
and
professionals example, consider
the following business rule: a
manager may be supervising many professionals or none at all
(e.g., a newly hired manager may not yet be assigned
to supervise any professionals).
However, a professional must always be
supervised by at
least one manager,
and
possibly by many managers. In terms of the EER
diagram, we need to show that
the participation of the PROFESSIONALS entity is
optional (it is possible
to have a
manager not supervising any professionals), and that the
participation of the MANAGERS
entity is mandatory
(every professional must
be supervised by at least one
manager).
From
a notation standpoint, the "optional" participation of
an
entity is indicated
by an "O" on the relationship line leading to the entity,
and
the "mandatory" participation of
an entity is indicated by a "|" (vertical
line) on the relationship line leading
to the entity. The following EER
shows that the participation of PROFESSIONALS in the supervises
relationship is optional
and the participation of MANAGERS is mandatory.
The diagram below should be read as
follows: "managers may supervise
either none or many professionals, each professional must be supervised by at least one and
possibly many managers."
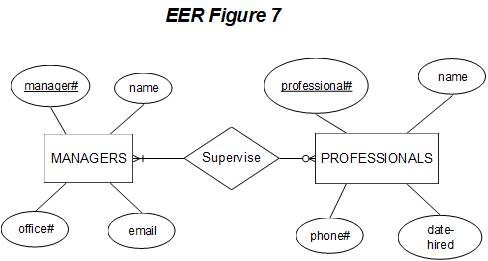
Finally,
let us see how an EER
diagram can be enhanced
to show entity attributes. Attributes are shown in an EER diagram
using ovals attached to
each entity or relationship.
In
the above figure,
let
us assume that managers
have the following attributes: manager# (primary key),
name, office#, phone#, and email.
Professionals have the following attributes: professional# (primary key),
name, phone#, date-hired. There are no attributes unique to the
"supervises" relationship (although it
is possible
for a relationship itself to have certain attributes
associated with it).
The EER diagram shown below includes
attributes. Note that the primary
key attribute for each entity is underlined.
Note that attributes are
often omitted in large
EER diagrams because the diagram
would become extremely cluttered if
each entity's attributes were shown. To
recap, the ER model
uses two symbols --
rectangles for entities and
diamonds for relationships. An EER model uses "crow's
feet" to show the "many" side of 1:M
and M:M relationships.
Attributes
in an EER model are shown using ovals, with key attributes
(primary keys) being
underlined. An "O" next
to an entity indicates
that its participation in the relationship is
optional, while an "I" indicates that
its
participation is mandatory.
The table below summarizes the various
cardinality and optionality variations. The cardinality/optionality for
entity "A" is the same in every row (set
at 1) and the cardinality/optionality for
entity "B" varies from row to row.
You should be able to extrapolate
the following entries for variations in cardinality/optionality for
entity "A."
|
EER Conventions and Interpretation
|
|
Figure
|
Interpretation
|
Minimum...maximum cardinality for entity "B"
|
|
|
Every A is associated with exactly one B, every B
is associated with
exactly one A
|
1...1
|
|
|
Every A may be associated with either
none or one
B, every
B is associated with exactly one A
|
0...1
|
|
|
Every A is associated with at least one B and may be associated with many
Bs, every
B is associated with exactly one A
|
1...N
|
|
|
Every A may be associated with either
none or many Bs,
every B is associated with exactly one A
|
0...N
|
Logical
process modeling using Data-flow
Diagrams
The EER modeling approach described above is
data-oriented in that
it is
aimed at logically
showing the data structure aspects of the environment under
examination. In contrast, logical process modeling
is aimed at showing the ways in which data items are modified--that is, the procedures that modify entities. As we discussed
in Chapter 7, a popular
tool for logical process modeling
is the data-flow diagram
(DFD). DFDs
are
useful for modeling
and understanding processes and the
flow of data relative
to processes in a system.
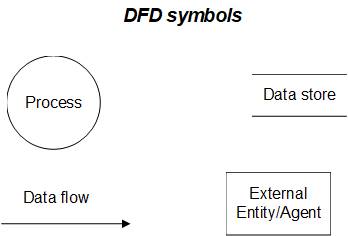
A DFD uses
only four symbols: circles
to represent processes, arrows to
represent flows of
data, open-ended rectangles
to represent
stores of
data, and a square
box to represent an external entity. The data store symbol should be interpreted to mean a
table in a relational database. The external
entity symbol is used to signify either
a source of data or a destination
for data. The four DFD symbols
are
shown below.
Levels of
Data Flow Diagrams
Data
flow diagrams can be
used to describe processes at different levels. At the highest level,
the DFD
is called
a context
diagram. A context
diagram treats the
entire information system as one process
and shows the inputs
to the system from external and internal entities, and the
outputs from the
system to external and internal entities.
Data stores
are not shown in a context diagram
because the stores are internal
to
the system. Context diagrams
are intended to be used by high-level managers such as controllers
and
the chief information
office (CIO). These users will
likely have an interest in
understanding the system at
a very general level
--
what inputs are going into the system and who is providing
those inputs, what are the outputs of
the system and who is
getting the outputs. That
is
exactly what the context diagram shows.
Details
about data stores being accessed and the specific
sub-processes within the system are irrelevant to those
high-level users.
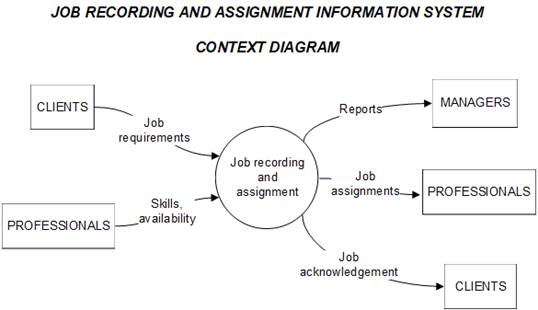
Returning
to our hypothetical CPA firm, consider an information system for recording client jobs and the assignment of
professionals to jobs. The system
accepts inputs from two entities --
one external (clients) and one internal
(professionals). Clients
specify the requirements for
each job. Professionals provide input
regarding their skills and also their
availability. Outputs from the system
comprise acknowledgment of jobs to clients, job assignment sheets to professionals, and reports
of jobs created to managers. Given the
"input-process-output" orientation of the context diagram, from left to right,
all
flows are shown going from
left to right
and
all flows are labeled. Flows
returning to an entity that provided
input are also shown from left
to right by repeating the entity to the right of the
process. The context diagram
for the "job recording and assignment" information system is shown below. Note
that the "client"
and "professional"
entities are repeated
on the right of the "job recording
and assignment" process.
At the next
level, referred to as Level
0, the DFD shows the major
processes in the system,
the
interaction between the processes, and the data stores used to store data. The reason for calling it a "Level
0" DFD is that
the
processes shown are labeled
1.0, 2.0, and so on. Let us assume that for our hypothetical CPA firm, the job recording
and assignment system involves
the following two procedures:
(1) record the job requested by the client and (2)
assign professionals to each job. Thus, the generic
"job recording and assignment" process shown in the context diagram
above is broken down to show the two sub-processes in a
Level 0 DFD as shown in the following figure.
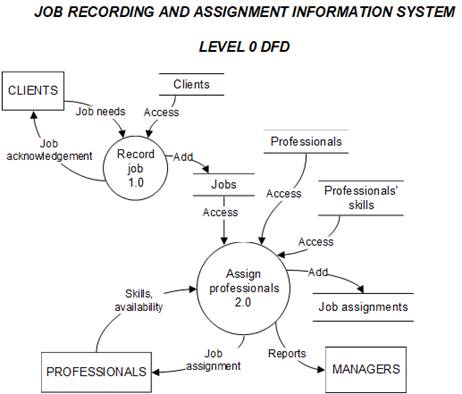
The
above Level 0 DFD
shows the two main
processes involved, namely the job recording
process and the job assignment process. It also shows the data stores
(files, or tables in a
database) accessed or updated
by the processes. Note that
every data flow is
labeled. The "Record job"
process (1.0) gets input from the client, accesses the client data store, and adds
an
entry to the jobs data store
(i.e., a new job is
created). The "Assign professionals"
process (2.0) accesses the jobs, professionals, and professionals' skills data stores. It also receives input from
professionals regarding their skills
and availability.
This process adds an entry to the "job assignments" data store which shows
the specific
jobs to which each professional is assigned. The
"Record job"
process generates
a job acknowledgement which is
sent to the client, while the
"Assign professionals" process generates a job assignment sheet which is
given to professionals and also reports which are given to
managers.
At subsequently detailed levels
(Level 1, Level 2, etc.),
processes are broken down even
further. A Level
1 DFD
expands on each of
the ".0" processes
in
a Level 0 DFD. As shown below,
the Level
1 DFD
provides details about what
exactly is involved
in the "Assign professionals"
process. Checking the skills
of professionals, checking
their availability, and actually
making the assignments are the three sub-processes
involved. Details regarding these steps are shown in the Level 1
DFD below.
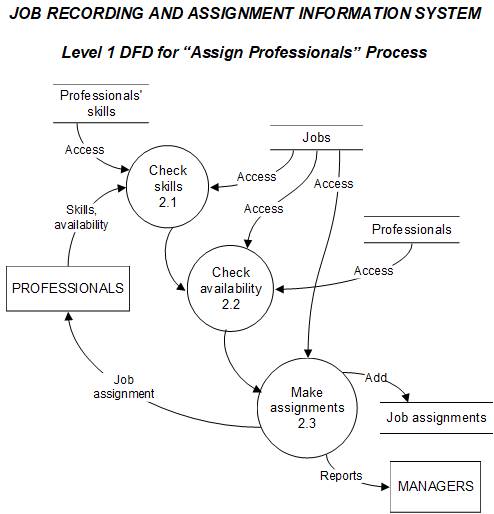
Unlike in the Level
0 DFD,
not all
processes in the Level 1
DFD would have the process
execution recorded
in a table. In the
Level 0 DFD for the “job recording and assignment” system, execution of
the
two high level
processes (record job
and assign professionals) need to recorded in data stores because
they are the main
processes that the
organization would like to
plan, control, and manage. The
purpose of the Level 1 DFD above, however,
is simply to provide more details regarding
the steps involved within a particular Level 0 DFD process.
Execution of the “check
skills 2.1” and “check
availability 2.2”
sub-processes are not each recorded
in data stores, because
these steps are
merely intermediate steps leading to the main step
of actually making
assignments. The execution
of the final “make assignments 2.3” step is recorded in a data store.
As with the Level
0 DFD,
in
a Level 1 DFD
data flows between external or internal entities and
processes must always be labeled
because they indicate the specific
inputs and outputs flowing
from or to entity. The labels
on flows between external or internal entities and
processes helps us
understand exactly what input
is being
provided to a process
and exactly what output is being
generated by the process.
Data flows between data
stores and processes generally have obvious meanings
-- arrows originating from a data
store indicate that the data store is being accessed, while arrows
going to a data store indicate that the data store is being updated. By "updated" we mean
that either new data is
being added, or existing data is being
changed. It is possible to have a double-headed arrow between
a process and a data store, meaning that the data store is being
accessed to read certain data and is
also being subsequently updated. In the figure above, note that the flows between the Level 1 processes
indicate the flow of control
within the process,
i.e., the result of
the “check skills” process is passed to the “check
availability” process, and so on. Given that the flows between
data stores and processes are
generally obvious, it
is common practice to not label
those flows.
While there is no
magical formula for consistently generating "good" DFDs,
some general guidelines to follow are:
(1) determine the scope
of the system,
(2) identify the processes involved and the relationship
(sequencing) between the processes, (3) identify the
data stores (tables) that will be accessed and/or updated, (4) label
all DFD elements,
and (5) to the extent possible,
avoid overlapping data flow lines.
A number of computer-based
tools are available for constructing DFDs. The
diagrams shown above were constructed
using Microsoft Visio, a
popular tool for constructing a variety of flowcharts and diagrams in the
business world.
R-E-A Modeling for
Designing Business Information Systems
Having discussed logical data and process modeling using EER and
DFDs, we return to the question
posed earlier -- how exactly
does one go about
constructing these models
for accounting information systems? Many systems
analysts and designers would contend that the process of developing
an EER model and corresponding
DFDs is more of an art than a science.
While there is some
truth to this contention, we believe
that following a structured set of steps
will lead you to at least a preliminary set of EER and DFD models for
the target accounting
information system.
We first explore logical
data modeling. While EER
modeling is a generic approach that is widely used for designing a variety of information systems, let us consider how EER modeling
can be applied specifically for designing data models for accounting systems. As discussed
in Chapter 1, a key feature of the database
approach to accounting is a focus on events.
Focusing on the key business events
in
the scenario under consideration
facilitates an identification of the entities
and the relationships between them (which is
the essence of EER
modeling). These business events involve resources and
are performed by and affect various
agents. For example,
a "cash sale" (an event)
involves "merchandise" and "cash" (resources) and
is done by "salespersons" to "customers" (agents).
This focus on resources, events and agents in the data modeling process was proposed by Professor Bill McCarthy under the name
REA modeling [1],[2].
Over the years
the REA framework has been extended and implemented by other researchers. In the REA approach
the key questions
to
ask are "what," "who," "when," and perhaps "where?" Answering
the "what" will reveal
the event itself and the resources
that are affected (increased or decreased). Answering
the "who" will
reveal the agents involved
with the event. Finally,
answering the "when" and
"where" questions will provide further
details about the
event -- details that will be helpful to us as
we
record the occurrence of the event. We shall next
examine how this
R-E-A modeling focus
on
resources, events, and
agents provides guidance for applying
EER modeling for designing
database- oriented
accounting systems.
The first and most critical
step is to identify the significant
business events or processes (e.g., a credit sales process). What
constitutes a "significant business event"?
Significant
business events are those business
activities that management wants to
plan, execute, and evaluate. These events are "significant" in the sense that the success
of the organization
depends on the successful planning,
execution, and evaluation of these events. The
two broad categories of business events are economic events such as sales and
purchases (i.e., the "accounting transactions" you
are familiar with) and
non-economic events (e.g., issuing
a sales quotation, taking a sales order). Economic events
involve increases or
decreases in resources such as inventory, cash, etc. Note that the REA framework deals specifically with economic events that directly
increase and
decrease resources and is thus well suited for
modeling of accounting phenomena. Subsequent
to the original REA specification,
McCarthy and others
have
specified commitment events as also important economic phenomena to be modeled. In
business terms, a commitment is a formal agreement
to
execute an economic
event at a specified time in the future. A common example of a commitment event
is a sales order, which is
an agreement
to
sell merchandise at some point in the future.
The execution of the sales order
is not an economic event—no resource
has increased or decreased. However, the sales order
will eventually be paired with an actual
sale event. Thus, in addition to economic (exchange) and non-economic events,
it is also important to identify
and model commitment events. One way to think about the distinction
between economic events and non-economic events is that economic events require
journal entries to be recorded while non-economic events do not. There is no journal entry recorded when a
business gets a sales order.
There
are three key types
of relationships in the REA framework: (1) stock-flow relationships, (2) duality
relationships, and (3)
participation or control relationships. Each of these is now explained. Relationships
between economic events
and economic resources are called stock-flow relationships because they either increase or
decrease the resource—there is inflow
or outflow of the resource as a result
of the event. In an economic exchange context,
every resource increasing
(decreasing) economic event will eventually have a corresponding resource decreasing (increasing)
economic event. This coupling
between resource increasing and decreasing events is referred
to in REA terms as
a duality relationship, which can be thought
of as a “give-take”
relationship (every “give” event will have a “take”
event and vice versa).
Taken together,
the
stock- flow and duality
concepts imply that
every increase (decrease)
in a resource is paired
with a corresponding decrease (increase)
in another resource. For example,
the
“credit sale”
event results in a
decrease in the
resource “finished
goods inventory” but will eventually be paired with an increase
in the resource “cash”
as a result of the
“collection” event when the
customer pays. There is
thus a “duality”
between the “credit sale”
and “collection” events affecting
the “finished goods
inventory” and “cash”
resources. Finally,
participation or control relationships define the internal and external agents associated with an
economic event.
Internal agents
are typically employees who execute (i.e.,
“control”) the event, while external
agents are the business partners who
participate in events. For example, a “credit sale” event
will have a “salesperson” internal agent and a “customer” external
agent. From an accounting
perspective, the internal agent associated with an event is responsible
for that event since he/she “controls” it. The three types of relationships in the REA framework are summarized in the
following table.
|
REA Relationships
|
|
Stock-flow relationship
|
Relationships between events and
resources. Either “inflow” or “outflow” relationships.
|
|
Duality relationship
|
Relationships between events. Each “increment” event has a corresponding “decrement” event.
|
|
Participation/control relationship
|
Relationships between events and agents. External agents “participate” in events, while
internal agents “control”
events.
|
The
basic REA pattern showing resources, events,
and agents together
with the three types
of
relationships, i.e., stock-flow,
duality, and control/participation relationships
is
shown in the figure below.
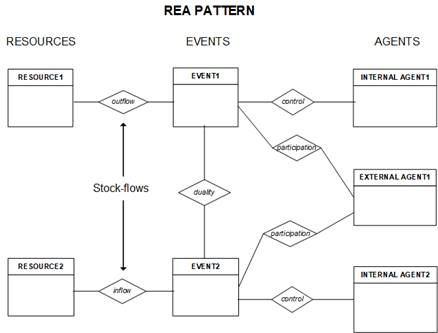
The
basic REA pattern shown above models economic events,
their impact on firm resources, and the agents
(internal and external) who are responsible
for and participate in those events. The
REA model can also be
used to depict non-economic events.
Non-economic events are those
that do not directly
involve an increase or decrease in resources, but have important implications for future
economic events. Commitment events
discussed earlier are examples of significant "non-economic" events.
Specifically, purchase orders and sales orders are non-economic events.
These orders do not
themselves involve resource
increases or decreases. However, these
events still are critical since they impact future increases/decreases in resources
(i.e., when the orders are eventually executed).
Examples of other
significant non- economic events
include obtaining feedback from customers
(which might help the company
improve its products and
thus result in
future sales), and routine inspections of machinery (which might
require future servicing).
Identification of "significant business
events" may seem somewhat mystifying
at times. When
deciding whether a certain activity is an "event" to be modeled, you should ask -- "Is this
something managers want to
plan, execute, and evaluate"? "Does the success of the organization
depend on the successful planning, execution, and evaluation
of the activity?" If the
answer to these questions is "No," then the activity is not an
event to be placed
on the EER diagram. It is likely that an activity you think is
an "event" may actually be an "information process."
Let us
next consider the difference between
business processes
or events
and
information processes.
Business processes versus information
processes
It is
important to distinguish between business events (business processes) and information processes. The key distinction to note is
that business processes
create new information, while information processes do not
create new information. Rather,
information processes are aimed at simply recording,
updating, or extracting existing information. A credit
sale to a customer
is a business process, but
the
act of actually recording
information about the sale and
generating a sales
invoice is simply an information process. Consequently,
the “credit
sale” business process
comprises a significant event
which is depicted
in the EER model and which eventually becomes
its
own table in the database, whereas the “generate invoice” information process
is not a significant event and will not become its own table in the
database. Of course, it
is
important and
necessary to keep track of information processes as they occur,
i.e., the invoice
number and date when the invoice was
actually generated. However,
such information is tracked
in tables of related
events, such as the “sale”
table or the “shipping” table (for example, if the invoice
is generated when the goods are
shipped). Identification of the key business events and
the related resources
and agents is done using
EER modeling. Thereafter,
identification of
the needed information processes
is
done using DFDs. It is
critical that you understand this distinction between business process modeling, for which we use EER diagrams, and information process modeling for
which we use data-flow diagrams. Let
us explore this
a little
further.
REA diagrams --
business process
(event) modeling
The
REA logical data modeling technique described above is
used to identify resources, events, and agents. The
first step is to identify the key business
events (e.g., sales,
ordering merchandise, receiving
merchandise, etc.). After having identified significant events, the
next step is
to
identify the resources involved with the business
event (e.g., finished goods inventory). Next, it is
necessary to identify
the agents involved with the business
event, who may be internal
or external
to
the company (e.g.,
salespersons are internal agents
and
customers are
external agents). Events,
resources, and agents are all depicted using
the entity symbol in an EER diagram. It
is then
necessary to identify exactly how the resource entities
and
agent entities are related
to the events identified. Note that the events too will typically be related
in a chronological manner (i.e., certain events precede other events).
For
example, the
"credit sales" event
would obviously precede the
"cash collections on account"
event. After identifying the events and related resource
and agent entities, the final step in logical
data modeling is to identify
the cardinality and optionality of each relationship.
Data-flow diagrams (DFDs)
-- information process modeling
Let
us turn to logical
process modeling. Recall that process modeling
is aimed at understanding
the flows of data
and the processes that modify data. Also note that information processes do not create
new information (only business
processes create
new information). There are three types of information processes modeled
using DFDs
-- recording processes,
maintenance
processes, and reporting
processes. Recording process DFDs are needed
for all events on
the EER diagram,
maintenance process
DFDs are needed for each agent and resource entity on the EER diagram, and reporting process DFDs are needed for every single entity on the EER diagram (resource,
event, and agent).
Recording
process DFDs: A recording process DFD is
needed to record
all aspects of each
business event identified in the EER diagram.
Recall that the "model integration"
step involves making explicit
links between logical data models
and
logical process models. In effect, the
"events" on the logical data
model map to "processes"
on a recording process DFD. The
business event (business process) results in the
creation of new information, while the recording process is used to actually
record the information resulting from the business event.
If there are multiple business events in
the EER diagram, a single DFD can often depict the recording processes for all events. It is also possible to
construct separate DFDs for the recording
processes associated with each
individual event. The rules for constructing recording process DFDs are
as follows: (1) each event entity on the EER
diagram will have a Level
0 DFD
process (i.e., 1.0, 2.0,
etc.), (2) the agents associated with each event
should be shown as external entity/agent symbols providing inputs to or getting output from the event process, (3)
all resource and agent
entities associated with the
event entity should be shown as
data stores being accessed and/or updated by the event process, and (4) a data store should be shown for
the event itself, with an arrow going to
the data store
indicating that it is being added to. For events related to other events, the preceding event's data store should be shown as being accessed by the subsequent event process.
Thus, related events are shown as being connected
through the data
store for the prior event. For two
related events, Event 1 and
Event 2, the data store for Event 1 is added to
by the Event 1
process, and the Event 1
data store is accessed
by the Event 2 process.
Maintenance
process DFDs: A maintenance process DFD is
needed for each resource and agent entity on the EER
diagram. Essentially, information about resources
(e.g., inventory) and agents
(e.g., employees, customers, vendors) needs to be maintained in
the information system. There are three
types of maintenance processes -- add,
update, and delete. Consider the case
of maintenance processes for a common resource in business
settings--inventory. Inventory
items can be added (a new product),
deleted (a product
that is discontinued), or updated (change in the description
or price of an existing
product). You can easily imagine similar
maintenance processes
for employees (add, delete,
update). Note that you will
inevitably have a series of
maintenance process DFDs that are not
linked to one another. In contrast,
all processes in a recording
process DFD for an event will
be linked,
through data store accesses.
The construction of
maintenance process DFDs
is relatively straightforward.
For an agent maintenance
process, the agent
will be shown as the external entity/agent and the agent data store will be shown with a double-headed arrow (since it
is being
both accessed and updated). If agents other
than the primary agent
are responsible for adding,
deleting or changing information, then they will also be shown. So there will
be one process (maintaining agent
information), one data store (that
agent's data store), and one or more
agent (depending on exactly
who provides the add/delete/update information). For resource maintenance processes,
agents responsible for maintaining the resource
information must
be
shown (even though they may not appear
on the EER diagram) and the resource data store will
be shown with a double-headed arrow indicating
that it is being both accessed and updated.
Reporting process DFDs: Depending on the number
of reports to be generated,
one
or more reporting process DFDs will be needed
for each event, resource, and agent on the EER diagram. By "reporting process" we simply mean the
extraction of information from one or more data stores to
generate either routine or non-routine reports. In REA terminology, the process of
periodically generating reports that summarize
the results of ongoing business events is referred to as conclusion materialization. In essence,
reports comprise “conclusions”
about the results
of business activity. Examples
of routine reports include sales analysis reports,
payroll reports, outstanding
purchase orders etc.
Examples of
non-routine reports include
"sales over $10,000 by John Smith in
California in April 2020." A key design decision for an event-oriented database system is
whether summarized data
representing the results of
event activity should be
stored in tables or re-generated
“on the fly” whenever
the report is requested by a user. For
example, a customer’s outstanding balance represents
the
sum of all credit
sales for that customer
less the sum of
all collections received
from that customer.
The customer’s balance
could either be stored in the customer
table or re-generated whenever
it is needed by summing
all sales for the customer and subtracting the sum of
all collections for that customer.
The
construction of
reporting process DFDs is very similar
to the process of constructing maintenance process
DFDs. The agents generating and receiving reports must be shown and the data stores
being accessed to generate
the reports must be shown with an arrow going
to the reporting process from the
data store. An arrow from the agent generating
the report to the reporting
process symbol is shown simply to indicate that the report is being
invoked by the
agent. All reports
being generated will be labeled outflows from the reporting process to agents
receiving the reports. Note that
some agents receiving
reports may be external
agents (customers, vendors). Therefore,
not all agents appearing
on reporting process DFDs
will appear on the EER diagram.
Note also that,
as with maintenance process DFDs,
it is
acceptable to have a series of
unlinked reporting process DFDs.
Recording vs.
maintenance vs. reporting
process DFDs: This differentiation between recording
process, maintenance process, and reporting process DFDs may
not be strictly observed in practice.
For example,
imagine a scenario
where the system
allows a customer
to change his/her address or phone number at the time a new sales
order is being recorded. The sales
order event would be captured using a recording process DFD,
but the changing of the
address and phone number is clearly a maintenance activity.
It
is perfectly acceptable
to incorporate that maintenance activity on the same DFD.
Similarly, if a report is
being instantly generated
at the time an event is being recorded,
that report would be shown directly on the recording process DFD (rather than
blindly constructing a separate reporting process
DFD
for that report). What
we
are driving at is that separate
maintenance process and reporting
process DFDs are needed only when those activities
are
conducted separately -- that
is, periodically (at the end
of every day,
every second day, weekly,
etc.).
REA modeling
-- a nine-step process
We have just discussed some general
guidelines for constructing a logical
data model for business events using the REA approach and logical process models
for information processes using DFDs.
Let us now specify a
detailed process of
developing an REA model (for the business processes) and related
set of DFDs (for all information
processes).
STEP 1: identify significant events (what is occurring?). Business
processes such as credit sales,
collections from customers,
returns and allowances, placing purchase orders, etc., are the typical events
you
would expect to identify
in a business oriented scenario.
Note that these events are akin to
"accounting transactions" that are usually included
in traditional automated
accounting systems. However, there could be other
significant events
such as salespersons calling on customers--events
that have historically been ignored
in accounting systems because there is no "accounting transaction" involved. Events that
are identified are
drawn using the entity symbol (i.e., a rectangle). Event entities should be drawn sequentially from top to bottom,
with the earliest
event at the top and the last
event at the bottom.
STEP 2: identify related resources
(what is being used/obtained?).
For each event identified in step 1,
identify any resources that are used
by, created by, or otherwise involved with the event. Resources typically have an "asset" connotation, such as
finished goods inventory, cash, raw material,
etc. Note that there
could be multiple
resources associated with a single event. As
each related resource is
identified, it is useful to construct
a label that is descriptive of the relationship between the resource
and the event.
This label should be used for the relationship symbol (diamond)
between the resource and the event in the EER diagram. Resources are drawn to the left of events
using the entity symbol,
with a diamond
connecting a resource
to all event entities
to which it has some
relationship.
STEP 3: identify related agents (who is involved?). For each event identified in step 1, identify any agents that perform the event or are otherwise affected by the event. Agents could be within the organization or outside the organization. Salespersons, clerks,
technicians, and managers
are
some examples of internal agents.
Customers, vendors, and providers
of services are examples of external agents.
Economic events
usually have both internal
and
external agents associated with the event.
As each related agent is identified,
it is useful
to come up with a label that
is
descriptive of the relationship between the agent
and
the event. This label
should be used for the relationship symbol (diamond)
between the
agent and the event in the EER
diagram. Agents are drawn
to the right of events again
using the entity symbol,
with a diamond
connecting an agent to all event
entities with which the agent has some relationship.
STEP 4: identify relationships. The relationships
between the events,
resources, and agents identified in steps
1 to 3 must
be
specifically identified.
Resources and agents
are typically related to one another
through
a significant event. Additionally,
as the duality concept
suggests, resources are both increased and
decreased through
events, which suggests
a pattern of relationships.
It is
possible (although relatively rare) that two resources
or two agents have a direct relationship not
stemming from any event.
It is
therefore necessary to also identify resources related
to one another and/or agents related
to one another. Finally, it
is necessary to identify
the interrelationships between events.
As
indicated in step 1, some events must be preceded and/or followed by other events. In essence,
it is
necessary to identify
the timing of events -- which events occur first, when occur next, and which occur last in a sequence of related events.
Note that it is
acceptable to identify relationships
as resources
and
agents are being identified, i.e., concurrently with steps 2 and 3 above. It is also acceptable to first
lay
out all events (in the
middle), resources (to the
left), and agents (to the right),
and
then determine and draw all
relationships.
STEP 5: specify the optionality and cardinality of relationships. A basic ER diagram should result from application of
the first four steps. It
is now
necessary to expand the basic ER diagram into an EER diagram.
For
each relationship identified in steps 2,
3 and 4, it is
necessary to identify
whether the relationship is
optional or mandatory and also the cardinality of the relationship (1:1, 1:M,
M:M). While the narrative
description may not necessarily provide details
about the optionality and cardinality of relationships,
it is
nevertheless useful to make logical
assumptions about these
aspects of the relationships. Of course, in real-world settings
key users
would be interviewed for clarification regarding relationships that are ambiguous in terms of optionality and cardinality. As a result of step 5,
the
basic ER diagram should develop into an EER
diagram.
STEP 6: identify the attributes of events, resources, and agents. Unlike basic ER
diagrams, recall that
EER diagrams also show attributes of entities. For each event,
resource, and
agent entity, it is necessary to identify
the attributes or
descriptors of that entity. In essence, the question being
asked for each event, resource,
and agent is "What is it about this event/resource/agent
that we want to
know about?" For example, the attributes of interest for a "sale" event would include the date of sale,
the
customer to whom items are being sold, which items are being
sold, in what
quantities, etc. For an agent entity such as a
customer, attributes would include the name, address, phone number, outstanding
balance, credit limit, etc. A resource
entity such as finished goods inventory might
have attributes such as part
number, color, weight, quantity on
hand, reorder point, etc. Ascertaining
the attributes of events,
resources, and agents frequently involves
interviewing users and reviewing
existing system documentation. As attributes
are identified, it is
sometimes easy to immediately indicate the primary
key attributes that uniquely identify resources,
agents, or events (e.g., part
number, employee ID,
sales invoice number). However,
it is
also acceptable to identify key attributes (primary and foreign) later in step 8. Note
that relationships themselves might have certain attributes, particularly in the case of many-to-many relationships. While in a real world modeling
setting all attributes would be noted on
the EER diagram, as we discussed
earlier attributes are sometimes
omitted from the
actual EER diagram to avoid an overly cluttered
diagram.
STEP 7: identify the information
processes. As indicated earlier, information processes are
modeled using DFDs for each of the three types of information
process-- recording, maintaining, and reporting. Each event
entity will require
a recording process. The recording
process captures all
relevant information about the
event. Such information constitutes various
characteristics of the
event as identified in step 6 above.
For a credit sale event, the recording process would capture
information about the date of sale, customer
to whom the items are being
sold, the items
being sold, etc. Each resource
and agent entity
will
require a maintenance
process to add, update, and delete information about the resource or agent. For example, maintenance processes will
be needed to add information about new employees, update information about existing employees, and delete employee information for those who leave the organization.
Finally, one or more reporting processes must be created
for every report
to
be generated.
STEP 8: design
the structure of the data repository.
Application of
the above seven steps will
result in the creation of logical data and
process models.
That is, one or more EER
diagrams for the business processes
and
a number of DFDs for the necessary information
processes. Step 8 is the
physical modeling step--the EER
and DFDs diagrams must be converted into a form suitable for implementation in a DBMS. Given that the most likely implementation target
is a relational DBMS, the necessary
tables must be created based on the EER
diagram, and the necessary database forms must be created
based on the DFDs.
Details
of this physical modeling
process are covered in the
next chapter--Chapter 9. As
a preview of the next chapter,
note that a table must be created
for each entity
symbol in the EER diagram and certain relationships
are also converted to tables. It is
also necessary to identify
primary keys
for each table and post foreign
keys between related
tables. The set of tables
resulting from conversion of
the
EER diagram constitutes
the
data repository for the business scenario.
STEP 9: implement the design. Once the data repository is
designed, implementation can proceed
using a relational DBMS. This design implementation is essentially the "systems
development" stage
of the systems
development life cycle.
In the
next chapter, we will
show how the data repository is
implemented using an increasingly popular relational DBMS--Microsoft Access. The specific implementation steps,
which are discussed in
greater detail in the next
chapter, are: (1) create tables using the attributes identified for each entity, (2)
designate the primary key in each table (no explicit action is needed to identify
foreign keys
in
Microsoft Access), (3)
establish relationships between tables, (4)
create a single-table form for each resource and agent entity--these single-table
forms are used to execute the maintenance processes for each resource
and agent, (5) create forms
(usually multi-table forms) for the event recording processes, and (6) create queries and reports for
all information processes.
These steps will be discussed in greater
detail in the
next chapter.
The results of
applying the above nine steps are a tentative EER diagram and corresponding
DFDs (one or more depending on the desired level of detail). This initial model
should be continually validated by consulting with users at various levels
in
the organization and other
information systems
personnel. The model would typically
be refined several times before designers proceed
with implementation of the
model in a particular
database environment. For example,
it is
perfectly fine to identify agents before
resources. It is also acceptable and probably more efficient to identify attributes at the same
time that resource and agent
entities are being identified. The initial steps may be revisited as the model is
continually refined based on feedback
from users.
Thus, there is typically quite some iteration between steps.
Recall that
the first seven steps laid
out above are performed
while reading the narrative
description and/or flowchart
of the business process
under examination. The information in the narrative description
and flowchart can be supplanted by interviewing agents
that are involved in the
execution of the business process
(e.g., salespersons, accounting clerks, and perhaps even customers
and suppliers).
Steps 1 through 6 are necessary to create an
EER diagram and therefore revolve around logical
data modeling. Step 7 focusing
on information processes with a view to constructing
DFDs is aimed at logical process modeling.
The last two steps, step
8 and 9, are aimed at
physical modeling
of the database
system. Step 8 is a
prelude to database
implementation, while step 9 involves actual implementation. Both step 8 and 9 will
be covered in the next
chapter.
First Comprehensive Example -- Student Registration
Processing
Let
us now demonstrate the application of
the above REA modeling technique
to
an example that
you are undoubtedly very familiar
with -- the process of
registering for classes. Given our focus on logical modeling
in this chapter, we will stop
at step 7 in the nine-step
process (steps 8 and 9 will
be covered in the
next chapter). To the
extent that the registration
process at your institution differs from
what is described below, it would be an interesting exercise for
you to modify the EER
and
DFD models shown below to fit the
unique aspects of the process at your institution. Assume that the following narrative resulted from an extensive systems analysis
process in which key individuals
in
the Registrar's office were interviewed and the registration process itself
was observed. As you read the
narrative, apply the above
modeling approach of identifying
events, related resources, and related agents,
following the nine-step process outlined in the
previous section.
Narrative
Every semester, departments within the university schedule courses. These course schedules
indicate the sections of
each course that will be offered, who will
teach each course-section, where the course will be taught, and
the days and times when
the course will be taught.
The maximum enrollment
in each course-section is
also indicated to the registrar. Obviously, each department can schedule many courses (i.e., many course-sections)
in a semester; however, each course-section scheduled
can be associated with only one department. Courses
need not necessarily
be offered every semester, and
each course can have multiple sections during
a semester. Instructors could
be teaching many courses in a semester, but it is also
possible that an instructor is not teaching any courses during a
particular semester
(again, perhaps in
the summer). One and only one instructor
must teach a course. The class schedule
for each semester published by the Registrar's office provides a summary listing of all course-section offerings
for all departments.
Prior
to each semester, the registration process occurs--students
register for courses based on the course offerings listed in the semester schedule. Registration requests
are
entered by students using
touch-tone phones accessing the registration processing system. This phone registration option is only available to current students
-- new students must go through
separate procedures
to register. The system first ensures that the student
is
a valid student at
the
institution. The student's
request is then verified to ensure that it is
complete, that the course requested
is a valid course, and that the enrollment
limit has not already
been reached. In case
of errors (invalid student, course, or if
the class is full), the student
is notified
by the system over the phone and the process ceases. If there are no errors, the student is registered
for the course.
A student can register for one or more courses, and
there could obviously
be many students
signing up for one course.
The registrations, therefore,
comprise students who
have successfully signed up for
each course.
Upon successful
completion of the registration process,
students receive a confirmation of their
schedule over the phone and also by mail. Periodically, the registration data
are accessed and used as
the basis for
billing students. Fee statements are mailed to students
who
have registered for courses. Before classes
begin each semester, departments
receive class rosters showing
students who are registered
for each course
being taught by the department. A number of
registration reports are
generated from the registration data every semester
and provided to the Registrar's office.
Based on
the above narrative
description of the registration
process, let us now construct (1) an extended
entity relationship diagram,
(2) a context diagram, and (3) a level
0 data flow diagram.
We will subsequently discuss the interconnections between the
extended entity relationship and data flow diagrams.
Applying the REA modeling
approach
Let
us now apply the
first seven steps in the REA modeling approach to the
narrative description above.
Step
1:
Identifying events: Analysis of the narrative
reveals two significant events:
1. Course scheduling (by departments each
semester; increases the inventory
of available course-sections for a semester).
2. Registration (by students for
courses scheduled each semester; decreases
the
inventory of available course-sections
in a semester).
Step
2:
Identify related
resources:
Although "course-sections" might not constitute resources
in the sense of
assets, they might be
thought of as "logical" resources
available to departments. That is, a department can only schedule
courses from
within its "bank" of
available courses. In that
sense, course-sections can be thought of
as resources (seats in classes) being made available
by departments at the university for use by students.
Step 3: Identify
related agents:
Course schedules
are established by departments,
which can be thought of
as agents within the university. Each course offered during
a semester is assigned to an instructor. Thus, instructors are agents associated
with the course offering
event. The registration event
is performed by students, who are external agents
(i.e., external to the university).
Step 4: Identify
all relationships:
Every registration event must relate to an existing
semester schedule. Departments and instructors are the
two agents that are related to the courses resources
through the course-offering
event. In addition,
students are involved
with the registration event.
Departments and instructors,
both agents in this
scenario, are clearly
related to one another.
Instructors are employed by departments. Students
and departments also have
a relationship--every student must declare a
major which is
unique to a department.
Finally,
the "registration" event follows
the "course scheduling" event
-- courses must first be scheduled
by departments and students
then register for
courses.
Step 5: Specify
optionality and
cardinality:
Each course-scheduling event
will involve offering one or more course-sections for
the semester. Each course-section can relate
to no course-scheduling events
(a
course that has never
been offered) or many course-scheduling
events (a course that
is
offered every semester). Thus,
the relationship between course-scheduling and
course- sections is
M:M. Each course-scheduling
event is associated with
exactly one department; however,
a department
can
have one or more course-scheduling events (the same
department scheduling courses in multiple semesters, as is likely).
Each course-scheduling
event will involve
assignments of one or more instructors. Each instructor can be associated with no
course scheduling events (e.g., a newly hired instructor), or many course-scheduling
events (a long
time instructor teaching for multiple
semesters). The relationship between course-scheduling
and instructors is thus M:M.
Departments can employ one or
many instructors, but an
instructor must be employed
by only one department. Thus, the
relationship between
departments and instructors is 1:M. Each registration event relates
to
exactly one course-scheduling event (i.e., a student
can
register for
courses in only one semester
at a time). However, each course-scheduling event can be associated with no
registrations (unlikely) or many registrations for the semester
(likely). Each
registration event
is
performed by exactly
one student; each student may have none or
many registrations in the system (a new student may have none, while a returning student will have many).
Each registration is for at
least one course-section but could be for many course-sections. The
relationship between
registration and course-sections
is also M:M.
Each course-section available could
have no registrations at all
(an unpopular course) or many registrations
(more likely). The relationship between departments
and students is 1:M (a simplifying assumption that
students can have only one major, while a
department can have many students majoring
in that department).
Step 6: Identify
attributes:
A
number of attributes for the resources, events, and agents
in the student registration process
are listed in the narrative description, but some attributes
are
added based on reasonable
assumptions. Course-scheduling
is keyed by a schedule
number for each semester
and will also include
the date and
other information pertinent to the schedule. The course-schedule also shows
the department offering
the course. Course-section will have a unique course-number and section number, a
description, the number of credit-hours, and pre-requisites
(if any). The “assigned-to”
relationship between
course- scheduling
and instructors shows the specific assignments for an instructor
in a semester, showing the course-section, the location,
date, and time of the course- offering,
and
the enrollment limit for the course-section. Instructors have a unique employee ID. The name, office number, phone number,
and date employed are some
of the other attributes of instructors. Every department
has a unique four-letter department
abbreviation (e.g.,
ACCT for Accounting). Students are
uniquely identified by their social-security number. In addition, the name, address,
phone-number, date-of-birth, current grade-point average, expected
graduation date, and
major (department) are other attributes of students
that must be maintained. Each registration has a unique
registration number. The date
of the registration, the student
associated with the registration, and the total fees due on that
registration are some
of the attributes of registrations
that must be maintained. The status of
each student's registration for each course-section must also be
maintained (e.g., "enrolled" or "waiting list").
Based on the above six steps, the REA diagram can now
be constructed. For ease of exposition,
attributes are omitted.
The REA diagram
for the student
registration system
follows.
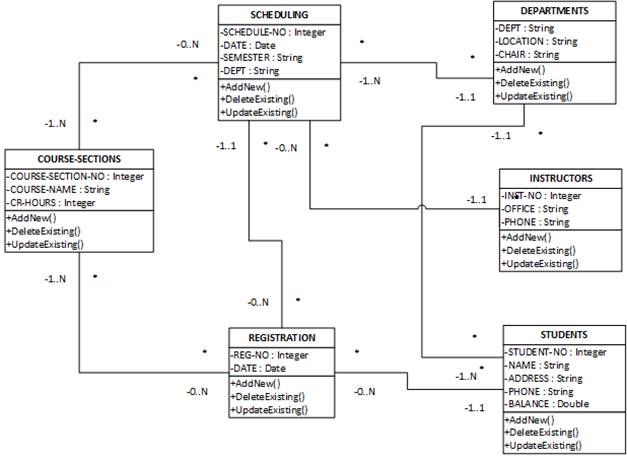
REA diagram
for Student Registration System
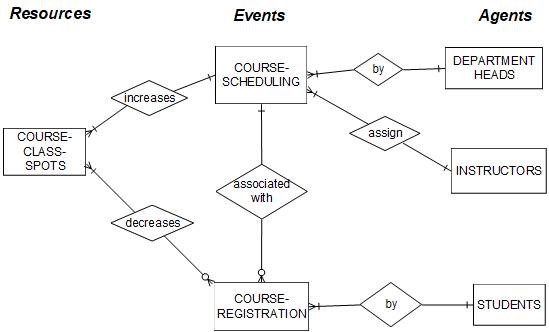
The
REA diagram above employs
the classic entity-relationship modeling
approach discussed earlier in the
chapter. Recall
that we briefly
discussed object-oriented modeling
using the emerging standard
"Unified Modeling Language" (UML). The Appendix to this
chapter shows a UML view
of
the above student
registration system model.
Step 7: Identify information
processes:
The entire system can be viewed as one overall
process of offering courses
and
registering for courses.
Inputs to the process
are received from students
(who make registration requests), from instructors
(who request courses
that they would like to teach),
and departments (who provide
information about their
course offerings for a semester).
Outputs from the registration
process include class
schedules and fee statements
to
students, teaching assignments to instructors, and class rosters to departments showing the students registered for each of
the
department's courses.
Based on this high-level of the events transpiring in the student
registration process, a context diagram
can be constructed, as shown below.
Context diagram
for
Student Registration System
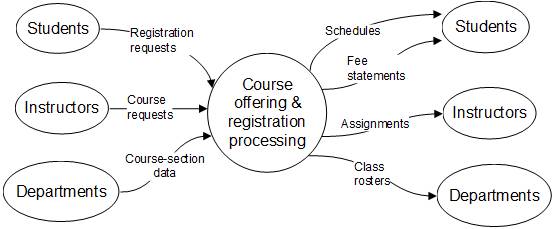
The context
diagram simply shows
inputs to and outputs
from the overall system.
As we discussed earlier
in the chapter, a "Level 0" DFD shows further details about processes. In
particular, recording process
Level 0 DFDs must be constructed for the events on
the REA diagram, maintenance process Level 0
DFDs must be constructed for
all resources and agents on the REA diagram, and
reporting process Level 0 DFDs must be constructed for
all reports to be generated. These Level
0 DFDs
show the specific steps involved in the
overall process and the data stores accessed
and updated.
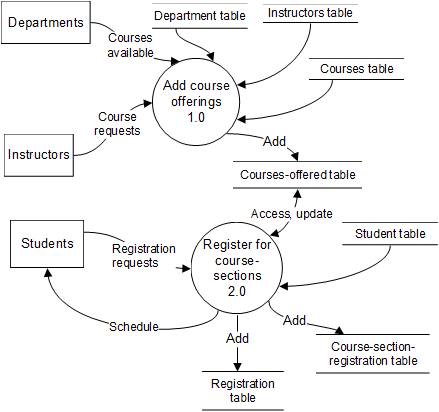
First,
let us construct the recording process Level 0 DFD
for the student registration system. We have already identified
the two key events
in
the student registration system--offering of courses
by departments, and registrations made by students. Each of these two
events will require a recording process. The recording process Level 0 DFD is
shown below.
The
second event, "Registrations," is associated with the
“students” agent entity (students
perform registrations), and is
linked to the “Scheduling”
event that must precede the “Registrations”
event. As with the first event, the "Registrations" process (2.0)
shows (1) inputs being
received from students, (2) the two data stores being accessed--students and course-offerings, and (3) the two data
stores being updated (data are
being added to the registration data store and the course-section-registration data
store to record the event).
The two information outputs from
the “Registration” event are course schedules and fee statements, both going to students.
The recording process level 0
DFD shown above can of
course be broken down further into a
Level 1 DFD. For
example, the process
of registering the student might
involve
(1)
determining
whether the student
exists in the student
table, (2) verifying the password entered
by the student, (3) determining whether the student
is in
"good standing" and is
permitted to register for
courses, and (4)
verifying availability in the course-section requested by the student.
These details could be shown in a Level
1 DFD
for the "registrations" process. For
all practical purposes, the level of detail
shown in a Level 0
DFD is sufficient to develop
a functioning database system. Therefore, the Level
1 DFD
is omitted.
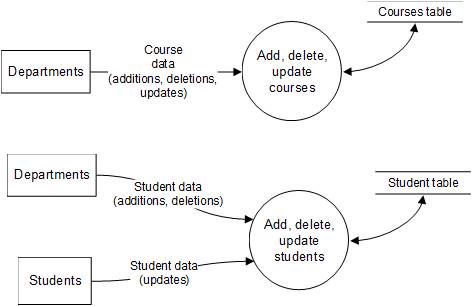
Let us now construct
DFDs for the other two information processes, namely maintenance
and reporting processes. Each resource and agent entity will
need a maintenance processes.
Note from the REA diagram that there is one resource entity (courses),
and
three agent entities (departments,
instructors, and students). Two maintenance
process Level 0
DFDs are shown below, for courses and for
students. The remaining
maintenance process DFDs, for departments and instructors will be very similar, of course
using different data stores, flow names,
and agents.
Maintenance process Level
0 DFDs for
Student Registration System
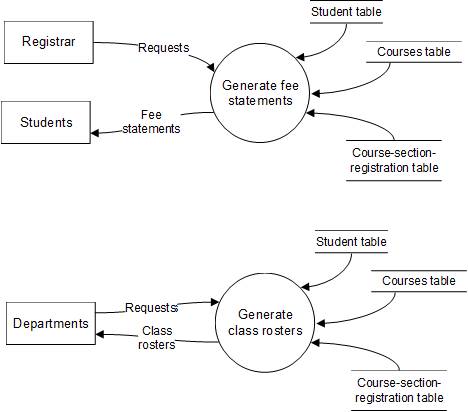
Reporting
process Level 0
DFDs should be constructed for every routine and
non- routine report to be generated. Some reports may be generated
at the same time that an event is recorded, a
distinct possibility in online systems. For
example, in the recording
process Level 0
DFD shown above, students'
schedules are shown as an information
output going back to students
because schedules are instantly generated upon completion
of the registration process.
Separate reporting
process DFDs are constructed for each report generated
independent of the event recording process (i.e., for periodic reports). Shown below are reporting process DFDs for fee statements sent periodically to students, per the registrar's request, and class rosters
sent to departments per
request.
Reporting process Level
0 DFDs for
Student Registration System
Second Comprehensive Example -- City Public Library
As another
example of applying
the event-oriented modeling approach, let us examine
the procedures involved
in lending books at a
public library. We will
again stop at step 7 in the
nine step process (steps
8 and 9 will be covered
in the next chapter).
Narrative
The
City Public Library
needs to keep track of its
members and books. There is no fee charged to
become a member
of the library.
However, members are assessed
a late fee if
books are not returned on time. Members
may check out as many books as
they like. It is important to keep track of books being checked out. Certain books
may
never be checked out. Obviously, a particular
book may be checked
out multiple times by different
members. It is
also possible that a
member has not yet
checked out any books. However,
only one member can be associated with a particular checkout. If
the member has any outstanding fines,
he/she must pay the fine before the checkout
is
permitted. The cash paid is deposited in one
of four different bank
accounts maintained by the library.
The member
is issued a receipt
showing the books that have been checked
out to that member.
Every check out is performed
by a library clerk,
and it
is
necessary to keep track of the clerk
who
processed a particular
check out. A library clerk
can perform
many checkouts, but newly hired clerks may not yet
have
performed a single check out.
Members return
books periodically. They do so by simply dropping
off books in a repository either
inside or outside the library (at
a drive-up window). Members may be returning books that were checked
out on different days. Returned
books are checked
in by library
clerks, and it
is again necessary to keep track of the clerk
who
performed the check in. The
clerk performing the check in may not
be
the same as the one performing the checkout. When the books are scanned in, the system retrieves the "check out number" indicating when the book was
checked out. If a book is
returned more than a week
past its due date, the member's
record must be updated to reflect the fine to be charged
at the next checkout
by that
member. Reports on books checked out, books checked in, and
fines paid need to be generated on a daily basis.
Based on the above narrative description
of the public library's
scenario, let us now construct (1) an extended
entity relationship diagram,
(2) a context diagram, and (3) a level
0 data flow diagram.
We will subsequently discuss the interconnections between the
extended entity relationship and data flow diagrams.
Applying the event-oriented
logical modeling approach
Let
us again apply the first
seven steps in the
event-oriented modeling approach to the narrative
description above.
Step 1: Identifying events: Analysis
of
the narrative reveals
two
significant events:
1. Checking out of books (by members).
2. Checking in of books (by
members)
Step
2:
Identify related
resources:
Two resources are involved in the
public library's lending scenario--books (being
checked out
and
returned), and cash from fines assessed to members.
Step 3: Identify
related agents:
Members are the external agent involved
in both the check out and the check in
event. Clerks are the
internal agent also
involved in both events.
Step 4: Identify
all relationships:
Every check out
event involves books, is performed
by a member, and is handled
by a clerk. Every check
in
event again involves books and is related to the check-out event.
Check ins are performed by members and
are handled by clerks. There could be a relationship between the check-out event
and
cash, depending on whether or not
the
member is paying a
fine at the time of
book check out.
Step 5: Specify optionality and
cardinality:
Every check
out event involves at least one and possibly
many books. Each check
out
relates to exactly
one member and is
handled by exactly
one clerk. Every check
in
event again involves one or more books and
could relate to one or
more check out events.
Every check
in
is performed by exactly one clerk. A check out event may involve cash if the member has to pay outstanding fines (but if no fines are
due the check-out event will
not involve cash). If cash is paid, it
is deposited
into exactly one cash (bank) account. Every cash (bank)
account can
have fines from either none or many check out
events. Clerks may be involved
in performing no check out
or check in events (newly hired clerk
in
training) or many of those two
events. The same
is true for members--they may be involved in many check
out events
or none
at all (an individual who becomes a member but never uses his/her
membership).
Step 6: Identify
attributes:
Some attributes for the resources, events, and agents in the public
library scenario should
be apparent from the narrative.
For example, members must be
identified by a unique member number. It will be necessary
to keep track of member names, addresses, phone numbers, and perhaps their email address.
For clerks, each will have a unique employee ID. Names, addresses,
phone numbers, and salary are some attributes
to be stored for clerks. Check outs and check
ins
must each have a
unique event number
(i.e., checkin# and checkout#). In addition, the dates of these events will have to be recorded.
For books, each should have a unique book number.
Additionally,
the title,
author, publisher, and perhaps ISBN number should be recorded. It is
also necessary to keep track of
the
number of times each book has been
checked out.
Based on the above six steps,
the
REA diagram can now
be constructed. For ease of exposition,
attributes are omitted.
The REA patterned EER diagram for the public
library book lending scenario is
shown below.
Step 7: Identify
information processes:
The
entire system can be viewed as one overall
process of checking
out and checking
in books. Inputs to the
process are received from members and clerks. Outputs of
the system, information about fines owed and
receipts, goes to
members (upon check out of books). Based on this
high-level of the events transpiring
in the library's lending scenario, a context diagram can be constructed, as shown below.
The
context diagram simply shows inputs to and outputs from the overall system.
As we discussed earlier
in the chapter, a "Level 0" DFD shows further details about processes. In
particular, recording process
Level 0 DFDs must be constructed for the events on
the REA diagram, maintenance process Level 0
DFDs must be constructed for
all resources and agents on the REA diagram, and
reporting process Level 0 DFDs must be constructed for all reports to be generated. These Level
0 DFDs
show the specific steps involved in the
overall process and the data stores accessed
and updated. Shown on the
following page is the recording process Level 0 DFD for
the library's book check out and check
in processes. The data stores shown in the DFD being accessed and updated can be linked back to the REA diagram, and the reason
for data stores
such as the “Checkin-Checkout” data store will become clear
in Chapter Maintenance and reporting process DFDs are not shown,
but you should be
able to construct those based on the student
registration system example shown earlier.
For example,
there will be a maintaining
process DFD for
members, clerks, books,
and the cash account.
There will be reporting
process DFDs for the
book check in event,
for the book check out event, and also perhaps
for books, cash, and members, to extract information about those events,
resources, and agents.
Recording process
Level 0 DFD for City
Public Library
The
above two examples
involved constructing an REA diagram,
a context diagram, and
Level 0 data flow diagrams. The last
two
steps in the modeling process -- steps
8 and 9 --
relate to physical modeling and will be covered in the next chapter.
Note that the models developed above,
of the student
registration system and the library
information system,
would have to be validated
by interviewing users. For
example, in the student registration
system context, department heads, perhaps
instructors, and students are the key agents that
would be interviewed to validate the REA diagram,
context diagram, and
data-flow diagrams constructed
above.
You might find it useful to return to this example
to review how specific
portions of the narrative description
link to particular aspects
of
either the REA diagram, the context diagram, or the Level 0
DFDs. While the linkages
between the DFD and the REA diagram may already be apparent,
we
will explore the connection between DFD and REA even further in the next chapter that focuses on physical modeling.
Summary
This chapter began by explaining the distinction between logical
and physical modeling. The focus of
this chapter was logical
data modeling using the entity
relationship approach
and logical process modeling
using data flow diagrams. The entity-
relationship approach
first proposed by Peter Chen was explored in some detail.
The ER approach uses two symbols
-- rectangles to represent
entities and diamonds to represent
relationships between entities. ER modeling
is data oriented, focusing
on the data that need
to be represented in the system.
Extended entity relationship
modeling was then
discussed. The process
of depicting
relationship cardinality, entity and relationship attributes, and the optional
or mandatory participation
in relationships was explained. Logical
process modeling using data-flow diagrams was
then discussed.
Data
flow diagrams focus on
processes and the logical flow of data in the system.
The different levels of
data flow diagrams, from
context diagrams to
"level 0" and "level 1" diagrams
were described. Event-oriented logical modeling was described using the Resources-Events-Agents (REA) approach, which focuses on the significant business events, the resources
involved in these events, and the
agents who perform or are affected by the events.
A nine-step REA modeling approach was described. Two comprehensive examples were then presented
wherein narrative descriptions
of a student registration system and a public
library's lending system were used as the basis for constructing extended entity-relationship diagrams,
context diagrams, and Level 0
data flow diagrams using
the nine step REA modeling approach.
References:
[1]
William E. McCarthy, "An Entity-Relationship View of Accounting
Models," The Accounting Review
(October 1979), pp. 667-686.
[2]
William E. McCarthy,
"The REA Accounting Model: A Generalized Framework
for Accounting Systems in a Shared
Data Environment," The Accounting Review (July 1982),
pp. 554-578.